Visualize Success with Our Exclusive Charts.
Charting the Course to Financial Growth.
Sign Up for FREE Now
Historical Charts
Our exclusive charts are your gateway to a wealth of historical data and powerful analytical tools. Dive into the world of visualizing market trends, exploring historical patterns, and making data-driven decisions like never before.
These propietary technical indicators can empower you to identify patterns and trends that can guide your trading decisions.
Unlock Insights: Explore Signaplex's historical charts effortlessly. Gain valuable insights into market trends and historical data, empowering your trading decisions.
See the Whole Picture: Our charts offer a comprehensive view of indicator trends over time. Make well-informed decisions by understanding historical data.
Trace the Connection: Connect the dots between historical data and our daily signals. This correlation unveils the "why" behind signals, making trading opportunities clear.
User-Centric Design: Think of these charts as your user-friendly guides. They uncover patterns, trends, and critical data for more effective decision-making.
As an example, we've included sample charts for the symbol AAPL
Fibonacci
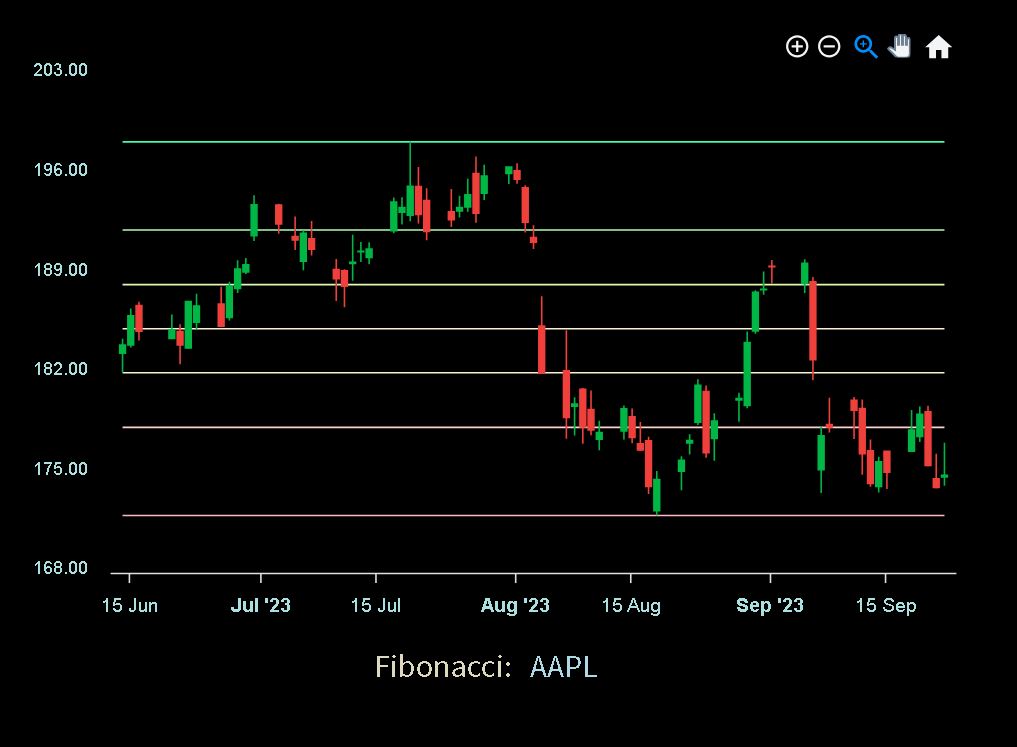
Explore Fibonacci retracements and extensions with our historical charts. Gain insights into how Fibonacci levels have influenced market trends, and understand their correlation with the formation of our daily sequential signals.
Momentum Channel
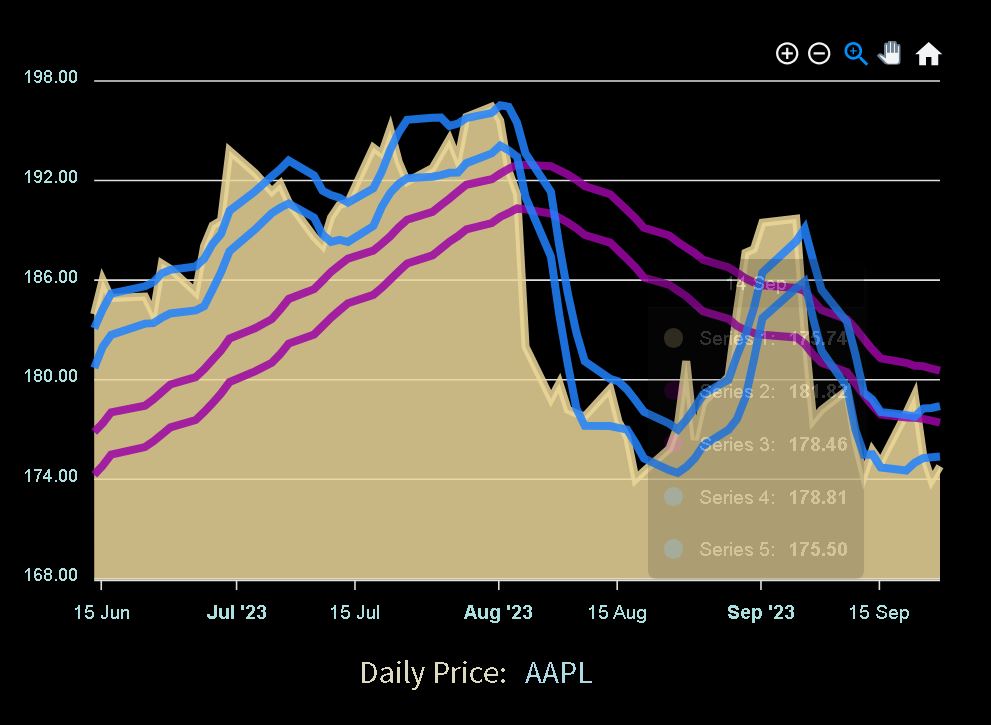
Dive into the Momentum Channel and witness the dynamics of market momentum over time. Our historical charts provide a visual journey of momentum fluctuations, and their significance in relation to our daily sequential signals.
POWER Indicator
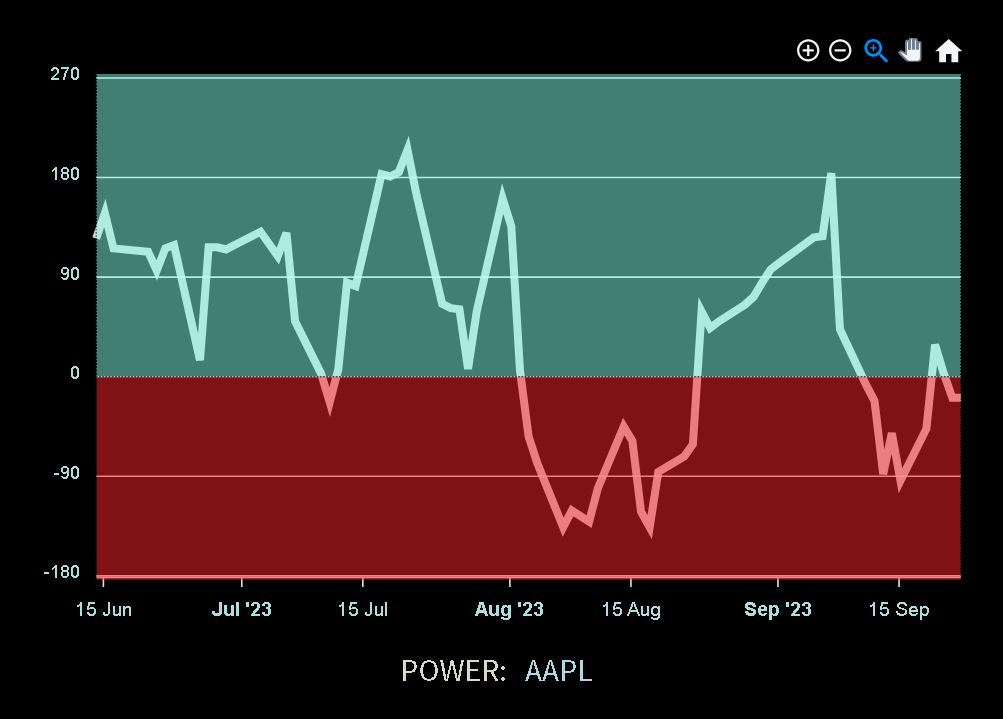
Explore how the POWER Indicator identifies crucial moments at the beginning of potential trends, both UP and DOWN, and learn how to harness these insights for strategic decision-making.
SPEED Indicator
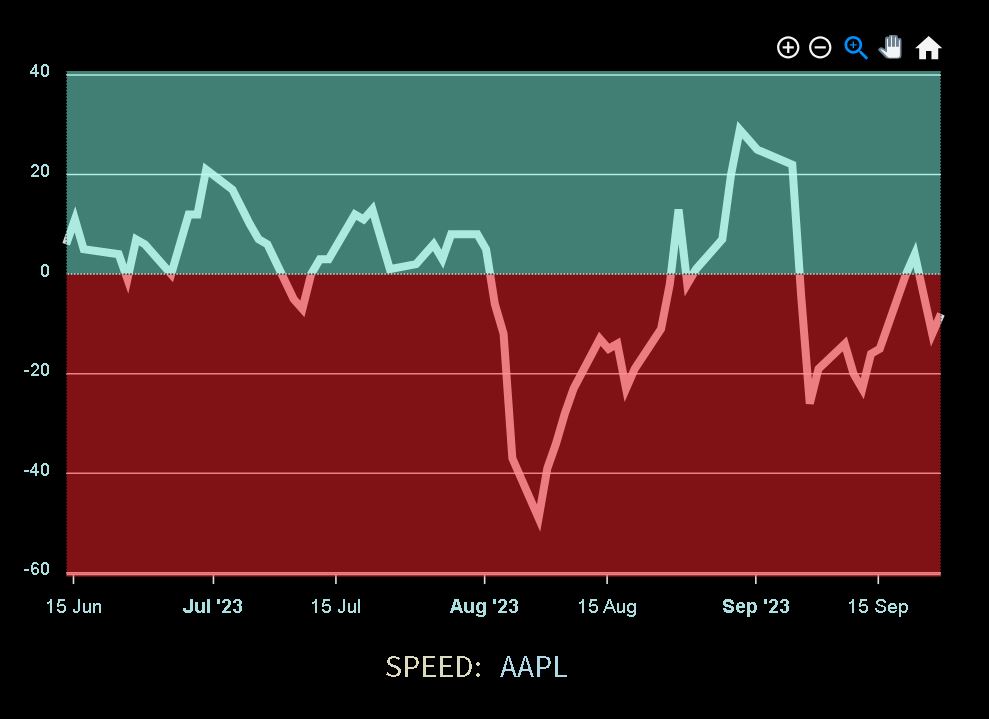
Get ahead of the curve with the SPEED Indicator's early trend insights. Our historical charts showcase the SPEED Indicator's ability to detect emerging trends, whether UP or DOWN, allowing you to make timely decisions in the fast-paced world of trading.
LIFT Indicator
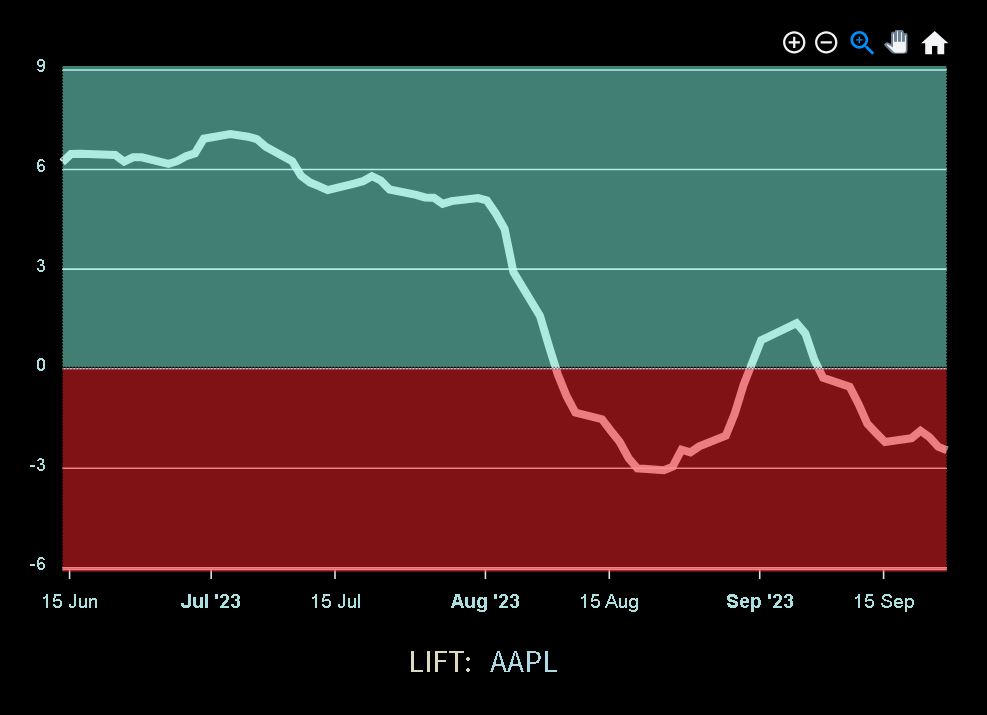
Elevate your trading strategies with the LIFT Indicator. Witness its knack for identifying the start of trends, UP or DOWN, and position yourself strategically for potential trading opportunities.
PITCH Indicator
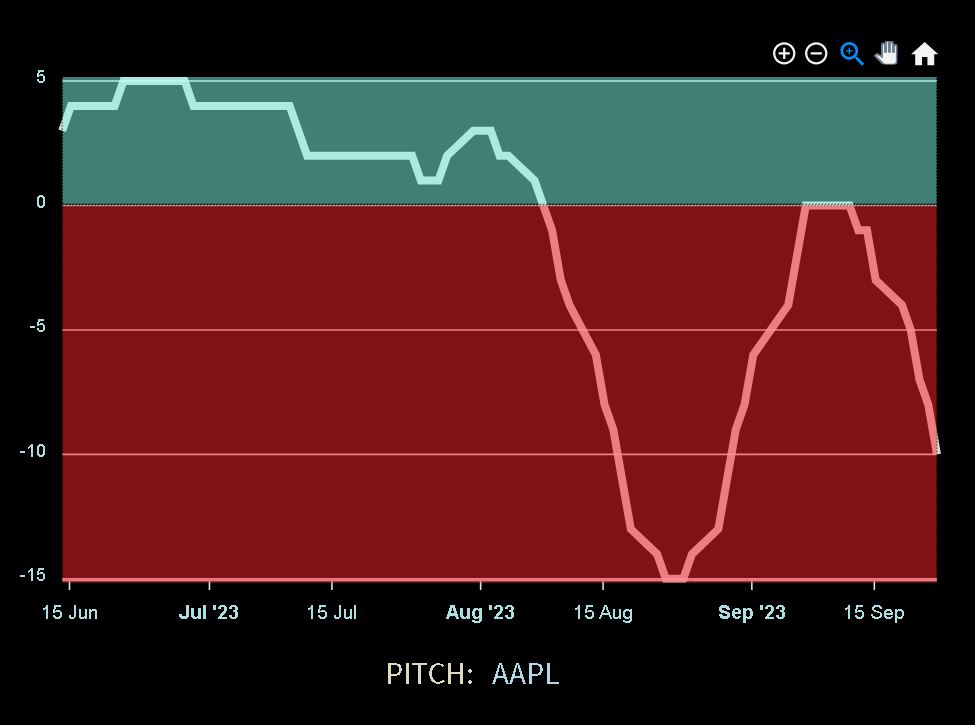
Navigate through established trends with the PITCH Indicator. Our historical charts illustrate how this indicator assesses trends, UP or DOWN, helping you focus on assets with the potential for sustained growth or decline.
SLOPE Indicator
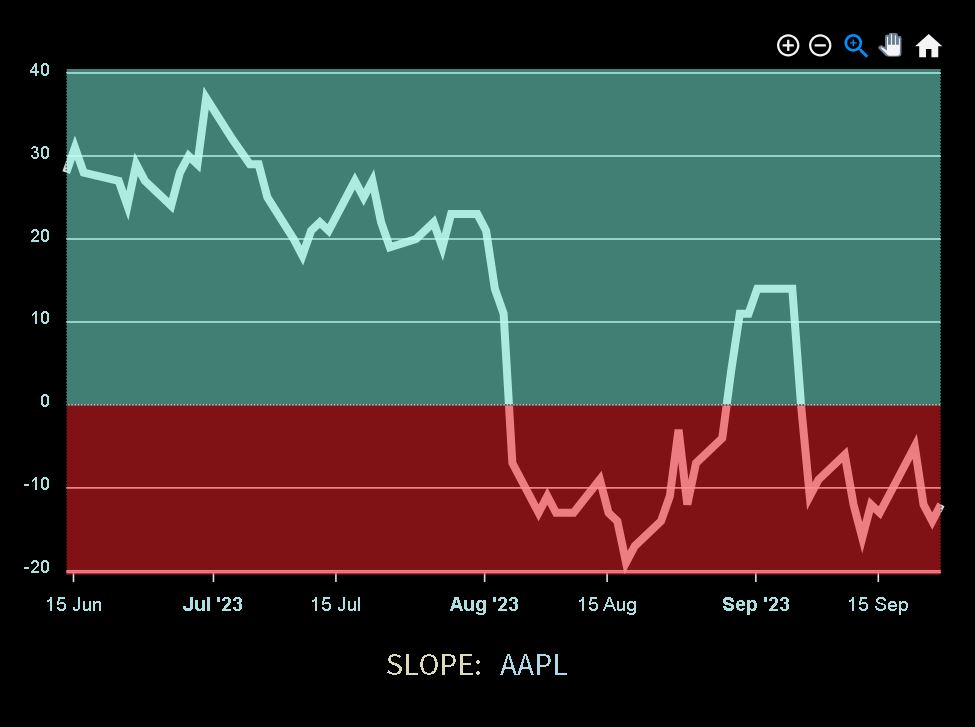
The SLOPE Indicator's historical charts reveal its ability to identify assets with established trends, whether UP or DOWN. Like a steady river, the SLOPE Indicator guides you towards stocks with established trends.
AI Next Day Candle
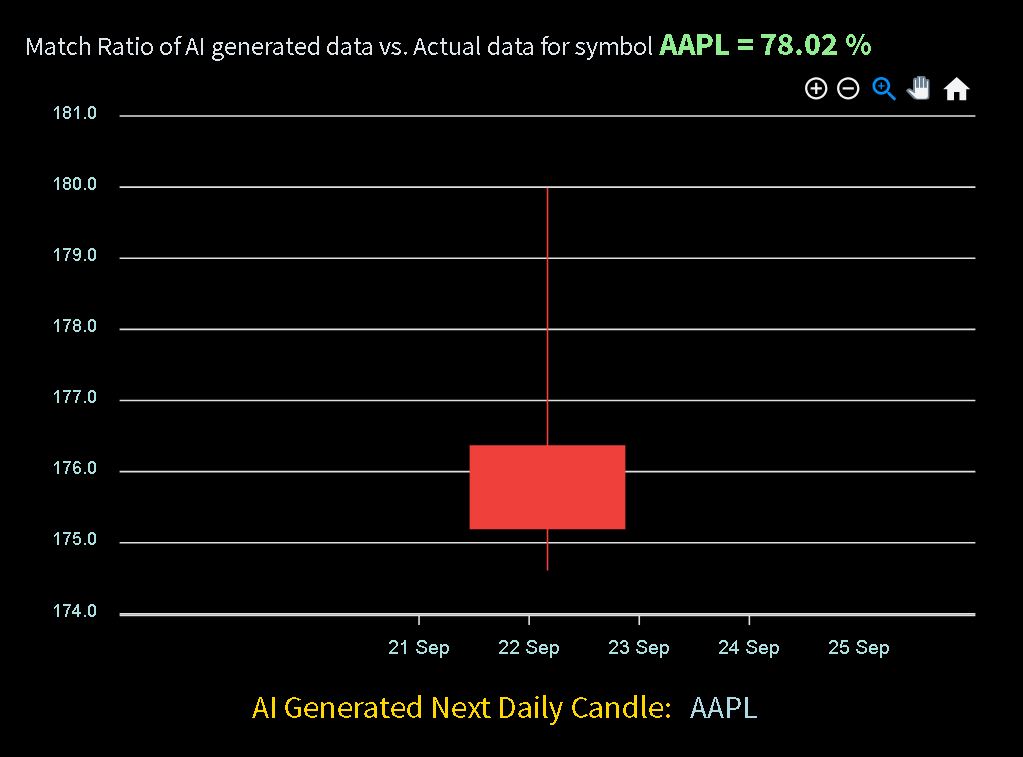
Embrace the future of trading with AI Next Day Candle insights. Explore our historical charts to understand how artificial intelligence influences market dynamics. Witness AI's impact on the formation of our daily sequential signals and stay ahead of the trading curve with data-driven decision-making.